In the world of distributed microservices, it is important to know what is going on inside your system. The Spring team understands how important observability is, and with the release of Spring Boot 3, made several changes to improve its use.
This quick demonstration will explore some of the new changes and how to implement them using the Grafana stack.
The full project can be found on my GitHub.
Table of Contents:
What is Observability?
This post will not be going in depth into what observability is, as there are plenty of articles on the subject.
For those who do need a quick introduction, the definition from Wikipedia explains it as:
... a measure of how well internal states of a system can be inferred from knowledge of its external outputs.
Our outputs in this case are the log messages, traces, and metrics produced by our services. Having this data is not enough to be called 'observability'. We still need to aggregate data from all our services and interpret it.
The Grafana Stack
Grafana is an open-source observability platform that brings together logs, traces, and metrics into dashboards. Grafana is the front end to several tools we will be using:
- Prometheus - Metrics
- Loki - Log Aggregation
- Tempo - Tracing
We will explore each of these while implementing the features of our service. The infrastructure for Grafana is provided in a docker-compose.yml, with a default URL of http://localhost:3000.
For this demo, I used two different dashboards:
- JVM Micrometer - Excellent for JVM specific data, such as cpu and memory usage.
- Spring Boot Observability - A simple dashboard that shows endpoint metrics.
I explored a third dashboard Spring Boot 2.1 System Monitor, but it required a little tweaking. With these dashboards as a base, you can create your own dashboards to fulfil whatever observability need you may have.
Lets Get Started
The demo project is a typical ReSTful microservice backed by a database. The full dependency list can be found here. For this post, we want to focus on the 'observability' side of things, so here are those dependencies:
spring-boot-start-actuator- Exposes metricsmicrometer-registry-prometheus- Provides an actuator endpoint for Prometheus to scrape metricsmicrometer-tracing-bridge-brave- The replacement forSpring Cloud Sleuth. Adds tracing capabilitiesdatasource-micrometer-spring-boot- Optional - Tracing of JDBC calls, separates connection and query into two spans and provides additional metadata.zipkin-reporter-brave- Exporter of our traces to Tempoloki-logback-appender (loki4j)- Exporter of our logs to Loki
Logging
Logging is the easiest of the three to set up, as every developer has done some sort of logging in their time. To get logs out of the service, we will use Loki4j, which requires no code changes. Loki4j is configured through a logback.xml file in our resources directory.
<?xml version="1.0" encoding="UTF-8"?>
<configuration>
    <include resource="org/springframework/boot/logging/logback/base.xml" />
    <springProperty scope="context" name="appName" source="spring.application.name"/>

    <appender name="LOKI" class="com.github.loki4j.logback.Loki4jAppender">
        <batchTimeoutMs>1000</batchTimeoutMs>
        <http>
            <url>http://${LOKI_HOST:-localhost}:${LOKI_PORT:-3100}/loki/api/v1/push</url>
        </http>
        <format>
            <label>
                <pattern>app=${appName},host=${HOSTNAME},level=%level</pattern>
            </label>
            <message>
                <pattern>${FILE_LOG_PATTERN}</pattern>
            </message>
            <sortByTime>true</sortByTime>
        </format>
    </appender>

    <root level="INFO">
        <appender-ref ref="LOKI"/>
    </root>
</configuration>logback-spring.xmlThe main components are the URL to send the logs to, and the format of our logs. The label pattern adds metadata for Loki so that logs can be separated by service name (app) and host, if we are running multiple instances. The actual log messages follow the FILE_LOG_PATTERN, which is Spring Boot's default pattern.
The below screenshot shows a log line from the demo, as well as the metadata labels we added from Loki4j.
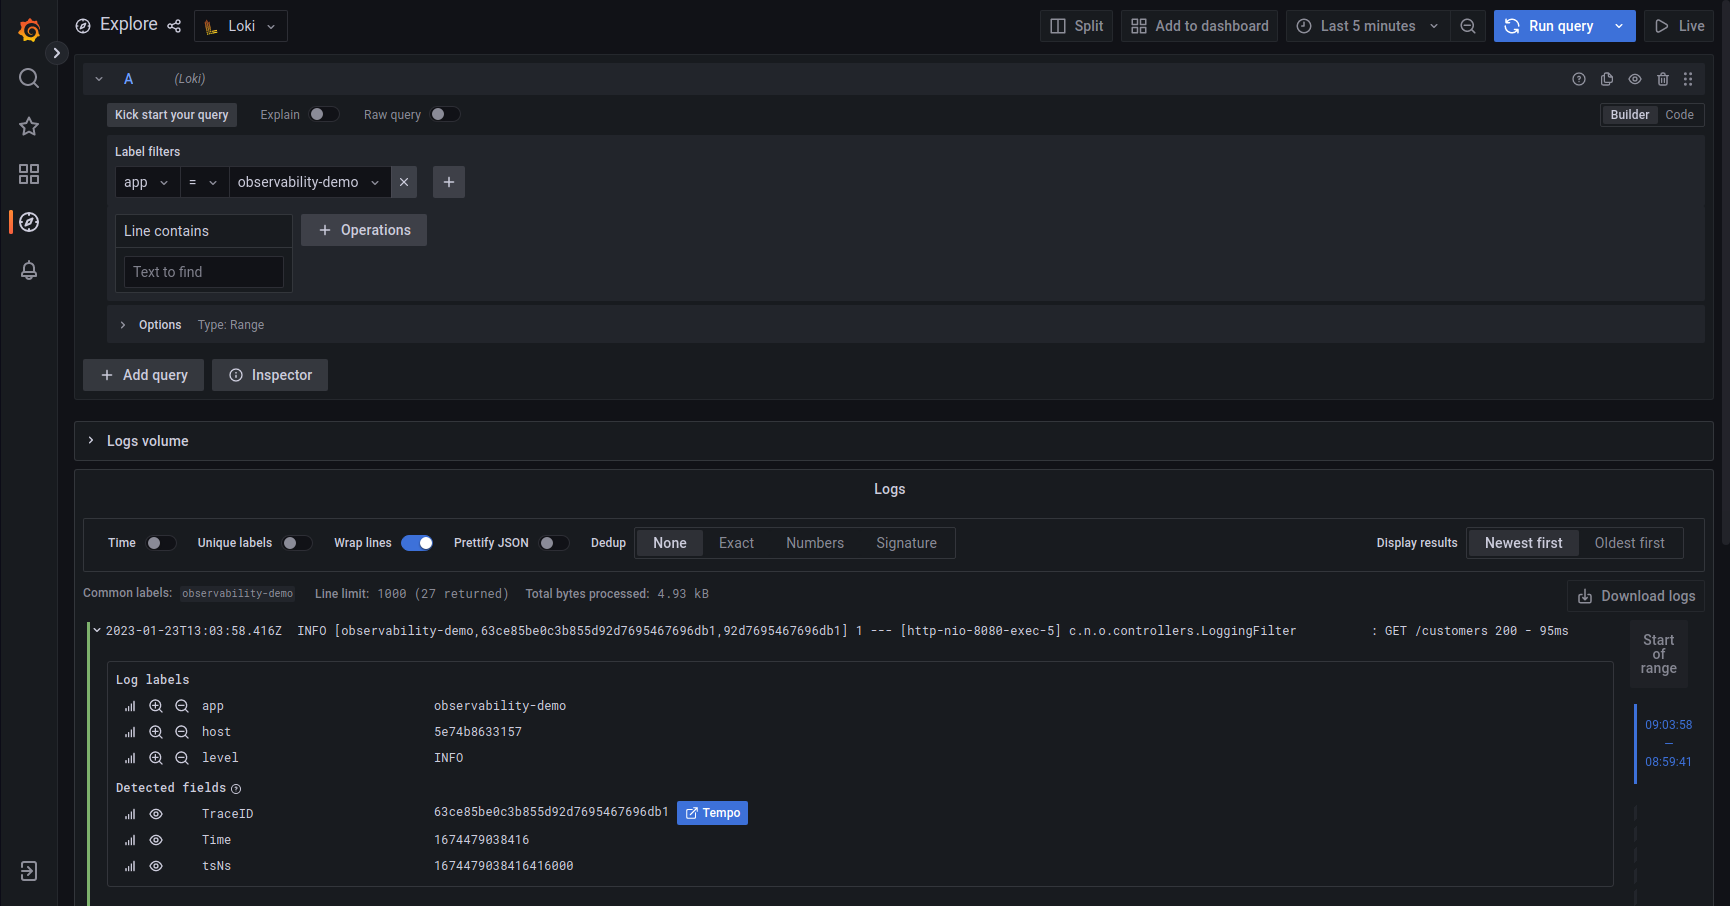
The log message in the screenshot contains trace and span information, which Loki recognised and provides an easy way to view the trace with Tempo. This data will be added in the next section.
Tracing
Spring Boot 3 brought big changes to instrumenting tracing. In Spring Boot 2.x, we could auto-instrument using Spring Cloud Sleuth, but this was replaced by Micrometer Tracing.
Spring Sleuth, minus the Spring dependencies, was actually absorbed into the Micrometer Tracing project,
In order to start tracing, we can use AOP to annotate which classes or methods should be traced.
To enable tracing, create an ObservedAspect Bean, tied to our ObservationRegistry.
@Bean
ObservedAspect observedAspect(ObservationRegistry registry) {
    return new ObservedAspect(registry);
}
We can now use the @Observed annotation to tell Micrometer where to add spans. @Observed can be used at the class or method level.
The annotation can be supplemented with a name, which opens up an interesting feature with metrics.@Observed(name = "customerController")introduces a new actuator endpoint at/actuator/metrics/customerController, that provides metrics for any traced calls. Adding@Observed(name = "getCustomers")to thegetCustomermethod of theCustomerControllerclass will create a more specific endoint:/actuator/metrics/customerController.getCustomers.
{
    "name": "customerController",
    "baseUnit": "seconds",
    "measurements": [
        {
            "statistic": "COUNT",
            "value": 2.0
        },
        {
            "statistic": "TOTAL_TIME",
            "value": 0.089593957
        },
        {
            "statistic": "MAX",
            "value": 0.087132967
        }
    ],
    "availableTags": [
        {
            "tag": "method",
            "values": [
                "getCustomers"
            ]
        },
        {
            "tag": "error",
            "values": [
                "none"
            ]
        },
        {
            "tag": "class",
            "values": [
                "ca.neilwhite.observabilitydemo.controllers.CustomerController"
            ]
        }
    ]
}/actuator/metrics/customerControllerAnnotations at the class level works well for controllers and services, as all of the methods should be concrete. If we want to trace database calls we need an additional step.
@Observed
public interface CustomerRepository extends JpaRepository<Customer, Long> {
    Optional<Customer> findByNameIgnoreCase(String name);
}CustomerRepository.javaThe above repository has a class level annotation for @Observed, which means its methods should all be traced, which is true. However, because the interface extends JpaRepository, inherited methods are not. To overcome this, we simply override the methods we want to trace.
@Observed
public interface CustomerRepository extends JpaRepository<Customer, Long> {

    @Override
    <S extends Customer> S save(S entity);

    @Override
    List<Customer> findAll();

    @Override
    Optional<Customer> findById(Long aLong);

    Optional<Customer> findByNameIgnoreCase(String name);
}CustomerRepository.javaNow when we call save or findAll, they will be traced like findByNameIgnoreCase.
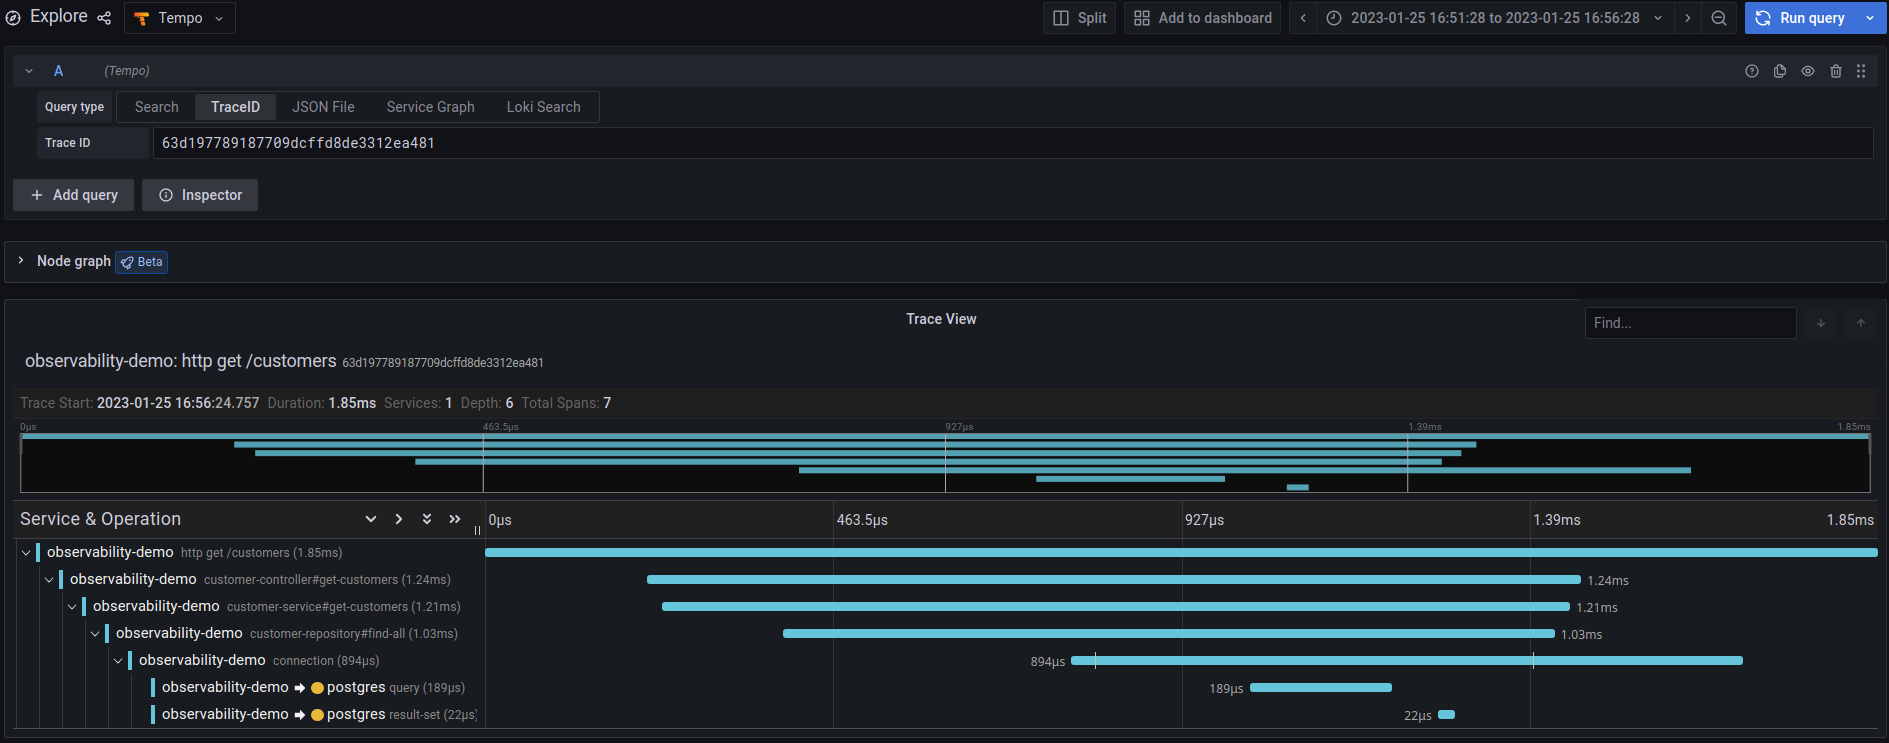
The following screenshots shows what a trace in Tempo looks like, as well as a node graph.

As shown in the Logging section, Loki was aware of trace id's in log messages. In order to add this data, we need to configure our logging pattern in application.yml. Traces are also sampled 10% of the time, by default, but can be configured:
logging:
  pattern:
    level: '%5p[${spring.application.name:},%X{traceId:-},%X{spanId:-}]'

management:
  tracing:
    sampling:
      probability: 1
  zipkin:
    tracing:
endpoint: http://${TEMPO_HOST:localhost}:${TEMPO_PORT:9411}/api/v2/spansapplication.ymlEvery log message related to a traced method will now contain the traceId(63d12d07a35486c62705beacbd5ad1c6) and spanId(2705beacbd5ad1c6):
INFO [observability-demo,63d12d07a35486c62705beacbd5ad1c6,2705beacbd5ad1c6] 704835 --- [nio-8080-exec-2] c.n.o.controllers.LoggingFilter : GET /customers 200 - 112msMetrics
Metrics provide the raw numbers of what is going on inside of a system, such as number of requests made to an endpoint, response times, and even information about the JVM itself.
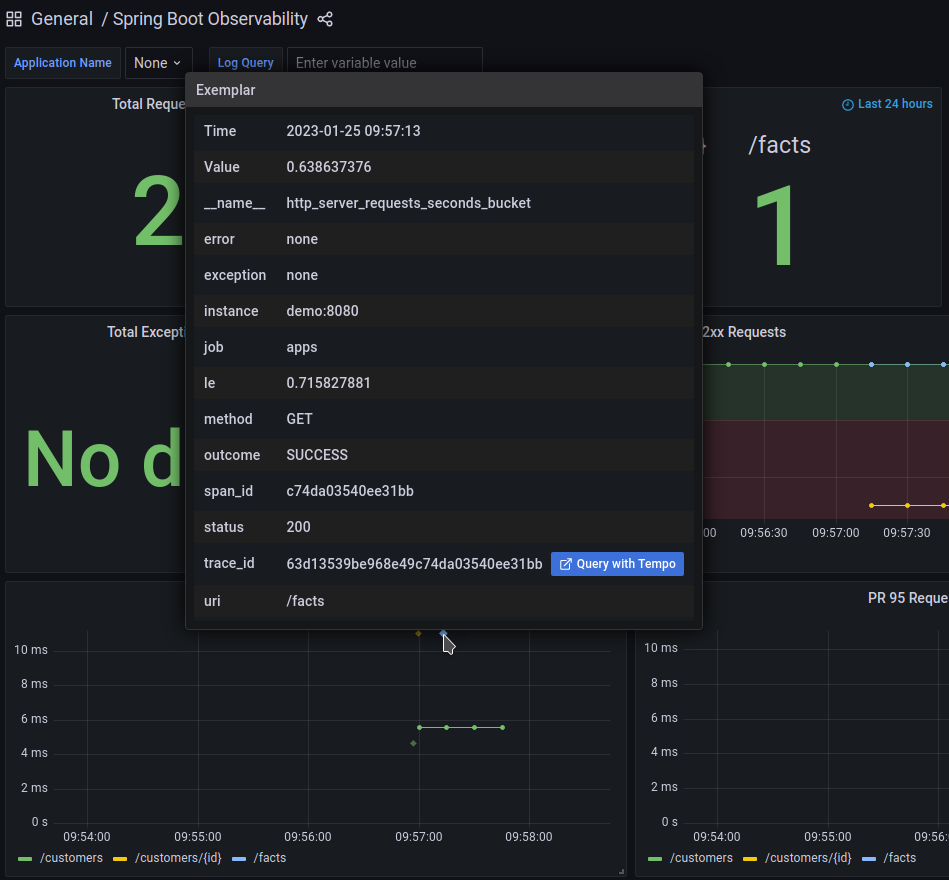
Spring Boot auto-configures many metrics, depending what is available on the class path. A full list can be found here. In order to expose metrics for Prometheus to scrape, we must add prometheus to the list of exposed endpoints in application.yml. For any custom metrics, we can also expose the metrics endpoint and build our own dashboards in Grafana. Spring Boot 3 and Micrometer introduced the support of 'Exemplars', which provides trace data, if available, for specific measurements. This is helpful if there is a spike in traffic or a request takes longer than usual. With an exemplar, you can see exactly which trace is related to the request. Exemplars are enabled by setting distribution.percentiles-histogram.http.server.requests to true.
management:
  endpoints:
    web:
      exposure:
        include: health,info,prometheus,metrics
  metrics:
  	tags:
      application: observability-demo
    distribution:
      percentiles-histogram:
        http:
          server:
requests: trueapplication.ymlOnce we have configured Actuator to expose the endpoints, Prometheus will scrape the data. The configuration for Prometheus can be found in docker/prometheus/prometheus.yml.
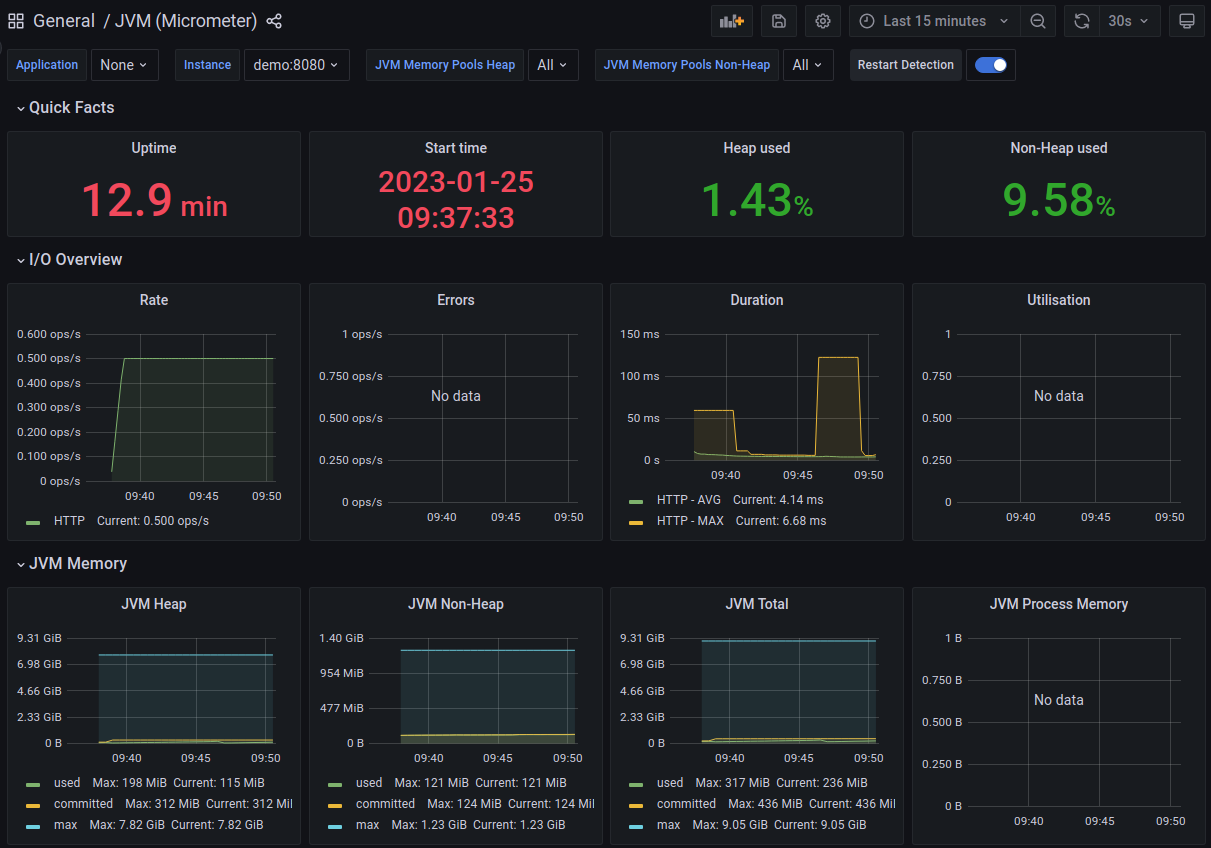
This screenshot shows some of the JVM metrics being collected. None of the Spring specific metrics are displayed in this particular dashboard, but is still very helpful in measuring resource usage and other JVM specific metrics you may be interested in.
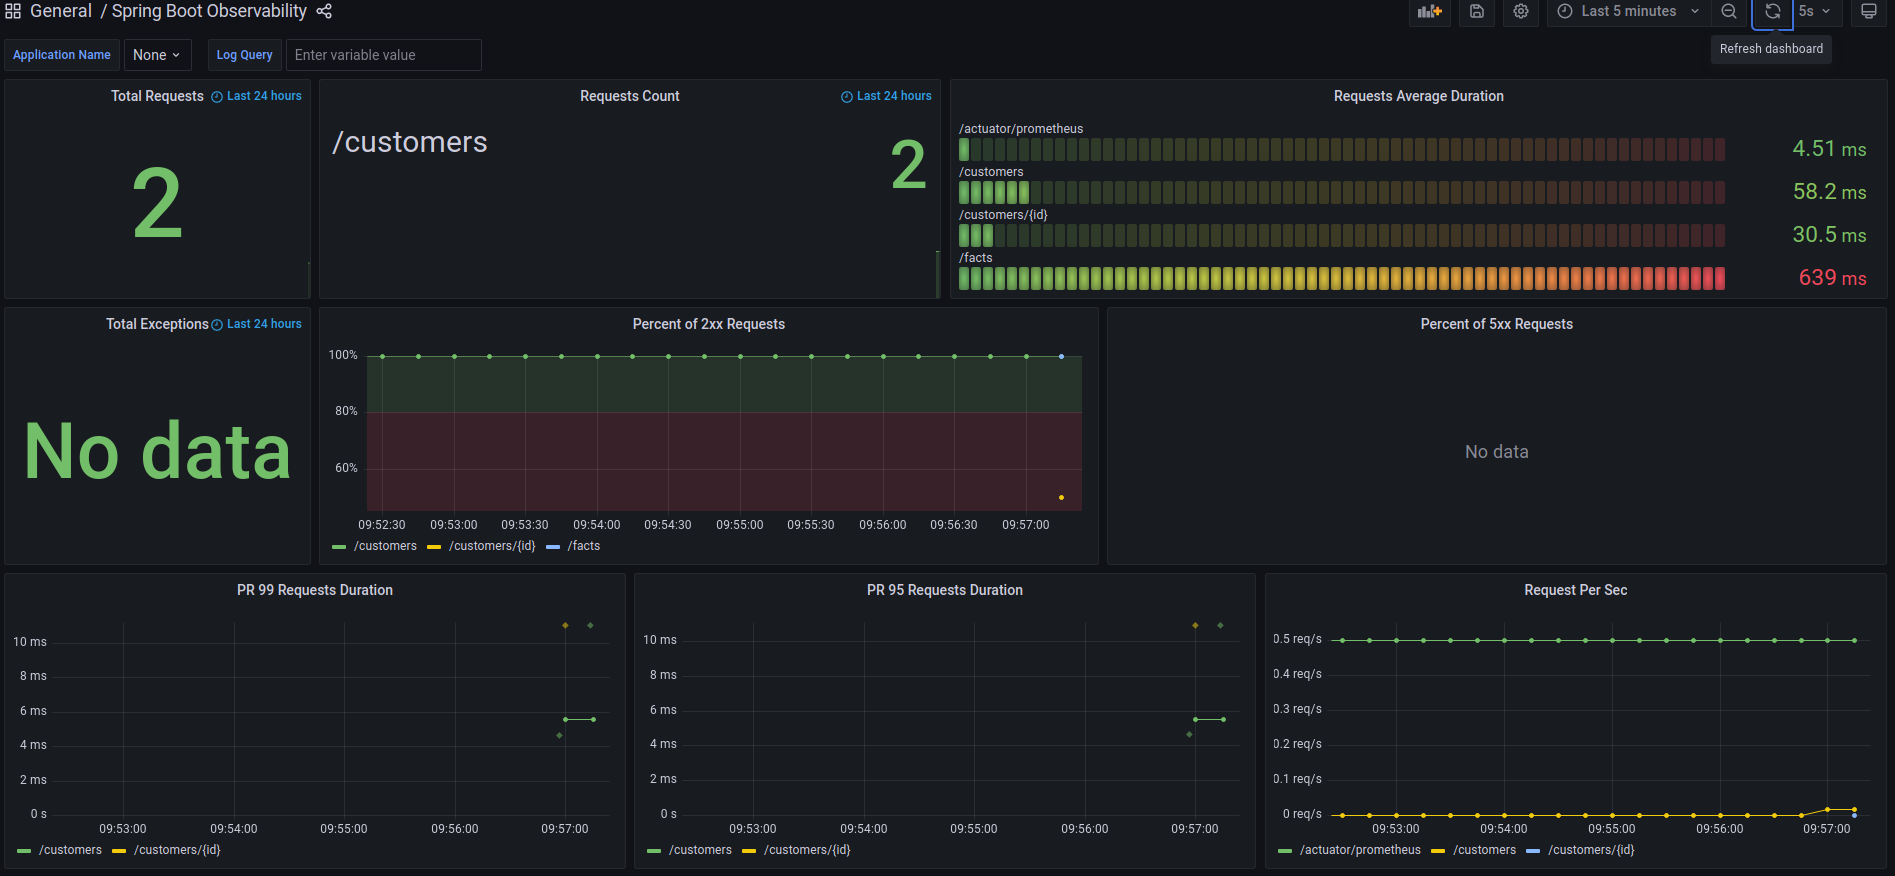
This screenshot shows specific metrics for Spring. The dashboard here is still very generic, but can be expanded to show whatever metrics and data you want.
Here is an example of an Exemplar. This particular request took longer than expected, so it was presented as an exemplar with additional data to drill down into.
Native Support
In order to maintain observability support when compiling to native, we need to add some hints to Spring Boot. For logging to Loki, we need to tell Spring to include our logback-spring.xml file, and for tracing, we need to ensure both the ObservationRegistry and ObservedAspect Beans are registered.
@Configuration
@ImportRuntimeHints(NativeConfiguration.RuntimeHints.class)
public class NativeConfiguration {
    static class RuntimeHints implements RuntimeHintsRegistrar {
        @Override
        public void registerHints(org.springframework.aot.hint.RuntimeHints hints, ClassLoader classLoader) {
            hints.resources().registerPattern("logback-spring.xml");

            hints.reflection().registerType(ObservationRegistry.class, MemberCategory.values());
            hints.reflection().registerType(ObservedAspect.class, MemberCategory.values());

			// Other hints
        }
    }
}
One big difference when compiling to a native image is that we lose the JVM, so related metrics are now gone. You can see this in the demo by running the native version of the service and viewing the 'JVM (Micrometer)' dashboard. The 'Spring Boot Observability' dashboard will still contain data.
Conclussion
Adding observability to a Spring Boot application is very easy and incredibly powerful in understanding your services. Troubleshooting of failing services or bugs, or finding bottlenecks to optimise become simple when you are able to draw insights from all your data.
I've only touched on setting up observability with a default configuration. Using the ObservationRegistry and Observation API from Micrometer, you can add custom metrics to your application. To learn more, head over to the official Micrometer documentation.
Happy Coding!